1. prometheus安装
Prometheus 主程序,主要是负责存储、抓取、聚合、查询方面
直接官网下载:https://prometheus.io/download/
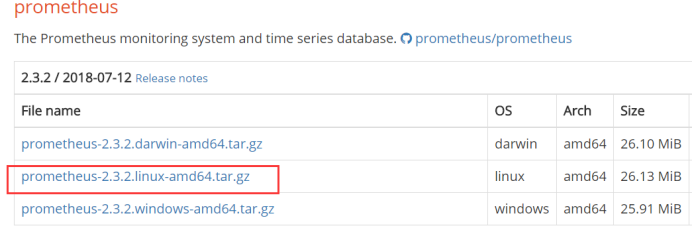
解压执行命令:tar zxf prometheus-2.3.2.linux-amd64.tar.gz
编辑解压目录下的prometheus.yml,执行命令:vi prometheus.yml
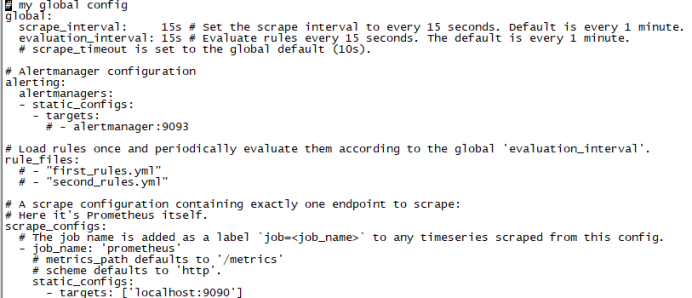
scrape_interval: 15s # 默认15秒到目标处抓取数据
job name 这个配置是表示在这个配置内的时间序例,每一条都会自动添加上这个{job_name:"prometheus"}的标签。
采用后台启动方式,在解压目录下执行命令如下:
nohup ./prometheus --config.file=prometheus.yml &
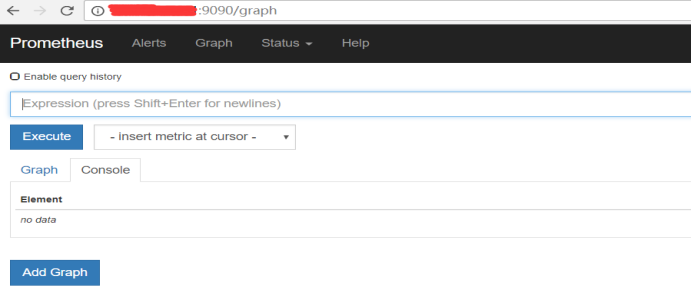
使用浏览器打开该机器的 http://部署机器:9090 ,或者 http://localhost:9090/ 即可以看到Prometheus的graph页面
2. node_exporter安装
node_exporter对于主机的关键度量指标状态监控
下载地址:https://prometheus.io/download/
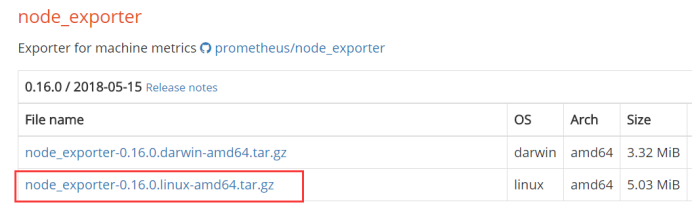
解压执行命令:tar zxf node_exporter-0.16.0.linux-amd64.tar.gz
采用后台启动方式,在解压目录下执行命令如下:
nohup ./node_exporter &
在prometheus.yml中增加配置:
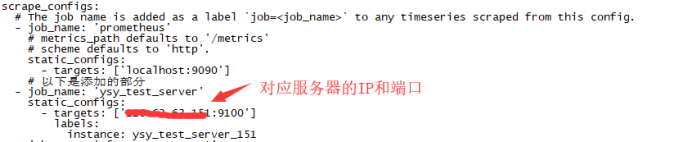
  - job_name: 'ysy_test_server'
    static_configs:
      - targets: ['ip:9100']
        labels:
          instance: ysy_test_server_151
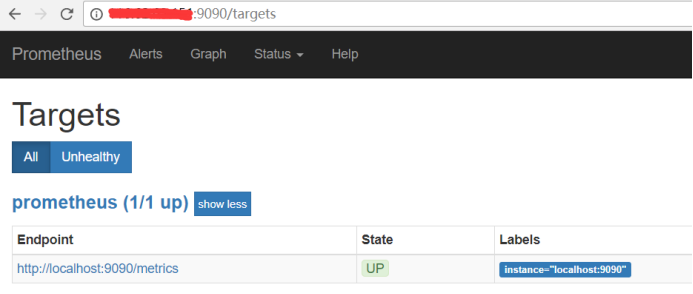
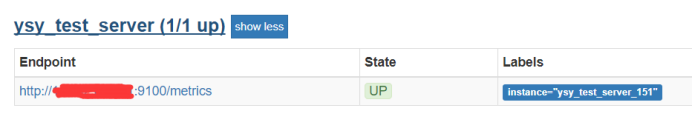
重新启动prometheus(启动命令参考prometheus安装过程中的)
浏览器访问:http://部署机器:9090/targets
3. mysqld_exporter安装
mysqld_exporter对于mysql监控
下载地址:https://prometheus.io/download/
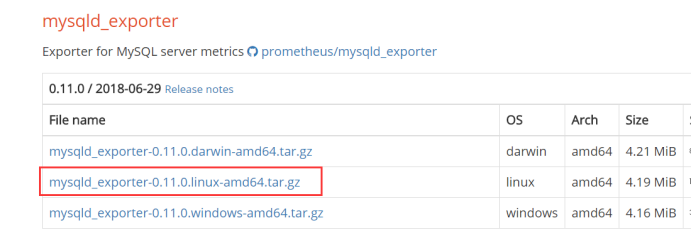
解压执行命令:tar zxf mysqld_exporter-0.11.0.linux-amd64.tar.gz
mysqld_exporter需要连接到MySQL,需要授权
mysql> GRANT REPLICATION CLIENT, PROCESS ON *.* TO 'test'@'localhost' identified by 'test123';
mysql> GRANT SELECT ON performance_schema.* TO 'test'@'localhost';
创建 .my.cnf
[client]

user=test

password=test123
#如果mysql的端口不为3306,需要配置socket指定对应的mysql.sock
socket="/var/lib/mysql/mysql.sock"
采用后台启动方式,在解压目录下执行命令如下:
nohup ./mysqld_exporter --config.my-cnf=".my.cnf" &
在prometheus.yml中增加配置:

-
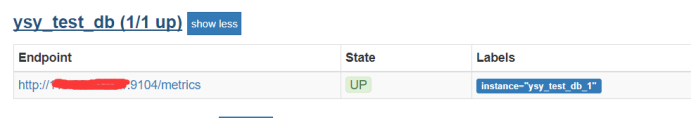
- job_name: 'ysy_test_db' -
static_configs: -
- targets: ['ip:9104'] -
labels: -
instance: ysy_test_db_1
重新启动prometheus(启动命令参考prometheus安装过程中的)
浏览器访问:http://部署机器:9090/targets
4. Grafana安装
Grafana是一个可视化面板(Dashboard),有着非常漂亮的图表和布局展示,功能齐全的度量仪表盘和图形编辑器,支持Graphite、zabbix、InfluxDB、Prometheus
下载地址:https://grafana.com/grafana/download
执行命令:
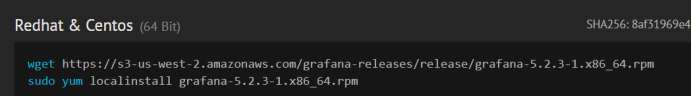
wget https://s3-us-west-2.amazonaws.com/grafana-releases/release/grafana-5.2.3-1.x86_64.rpm
sudo yum localinstall grafana-5.2.3-1.x86_64.rpm
一波操作完看到如下内容表示安装成功:
###

/etc/grafana/grafana.ini

###

sudo /bin/systemctl daemon-reload

sudo /bin/systemctl enable grafana-server.service

###

sudo /bin/systemctl start grafana-server.service
启动执行命令:
sudo /bin/systemctl start grafana-server.service
访问页面http://服务器IP:3000 ,默认账号、密码admin/admin
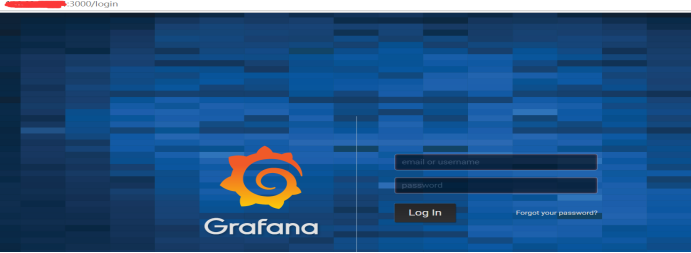
看到这界面,恭喜你,成功了
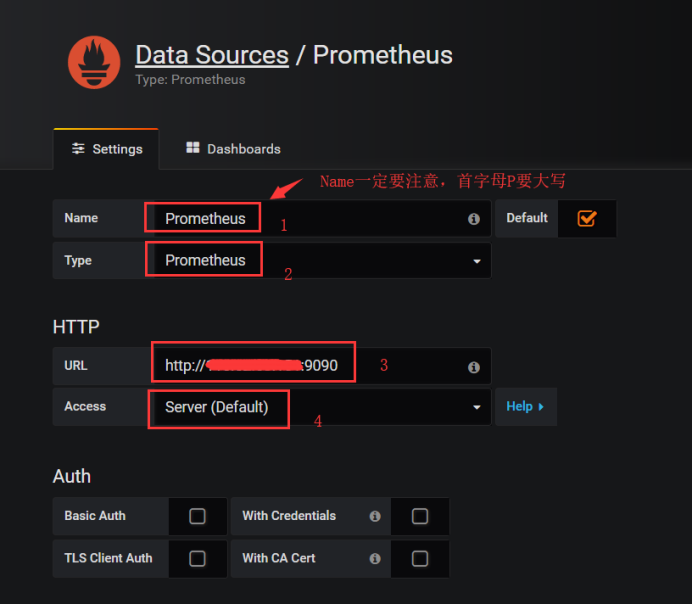
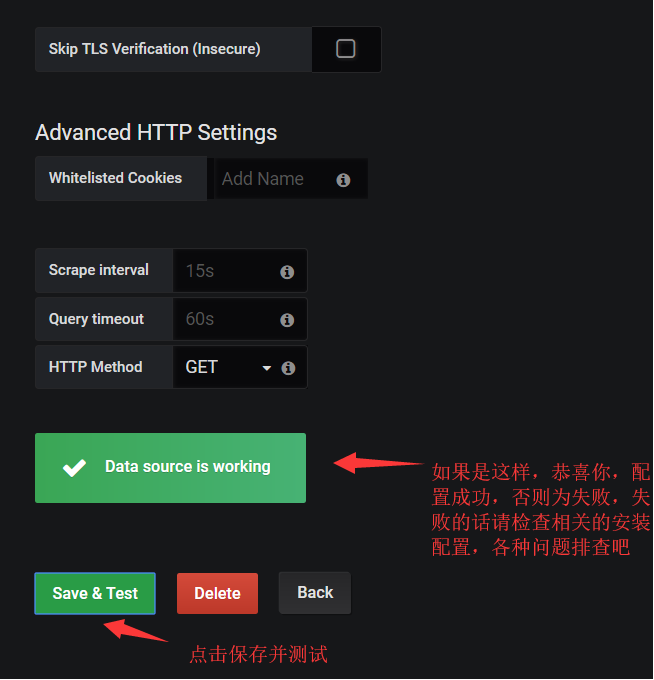
登录执行设置数据源
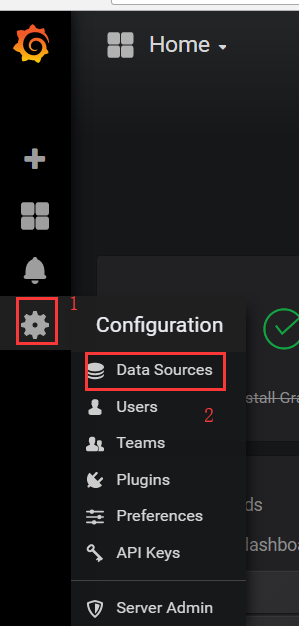
进入配置界面
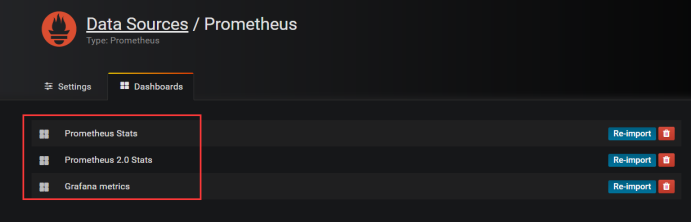
配置成功之后可以把默认dashboards的导入
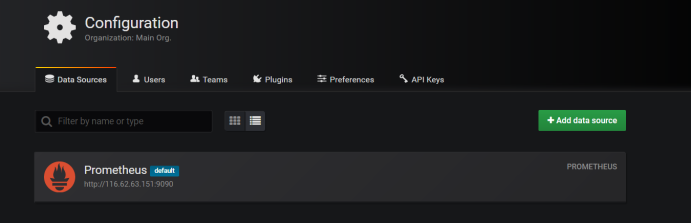
这时候你再进入到datasource可以看到刚配置的数据源;
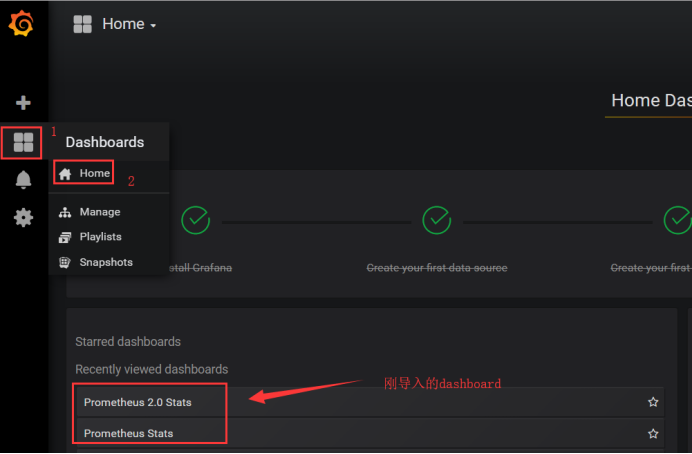
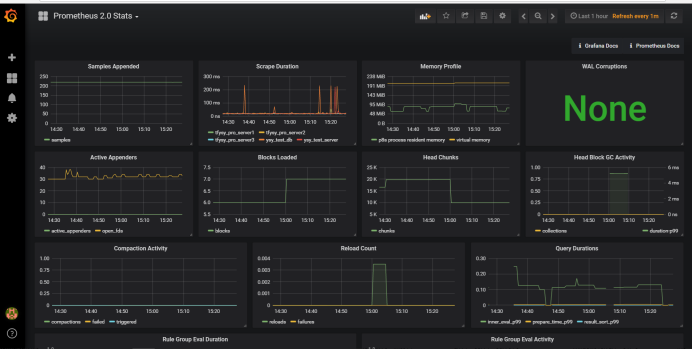
点击Prometheus 2.0 Stats:
5. Grafana安装
grafana-dashboards是一个可视化面板,有着非常漂亮的图表和布局展示,功能齐全仪表盘展示等
下载地址:
https://github.com/percona/grafana-dashboards
下载到本地
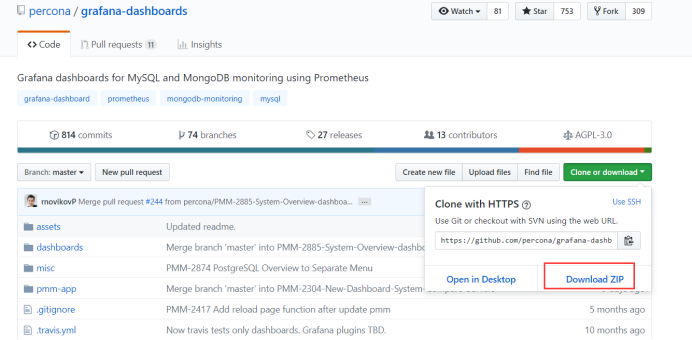
或者clone下载
git clone https://github.com/percona/grafana-dashboards.git
也可以下载tag版本
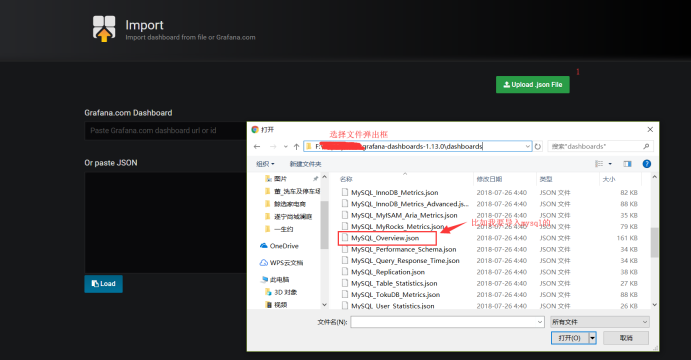
我下载的是grafana-dashboards-1.13.0
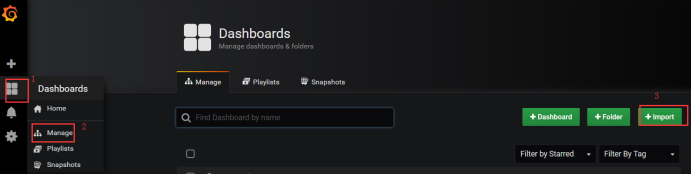
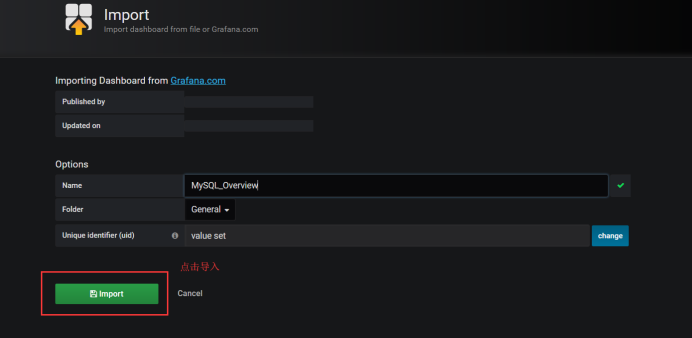
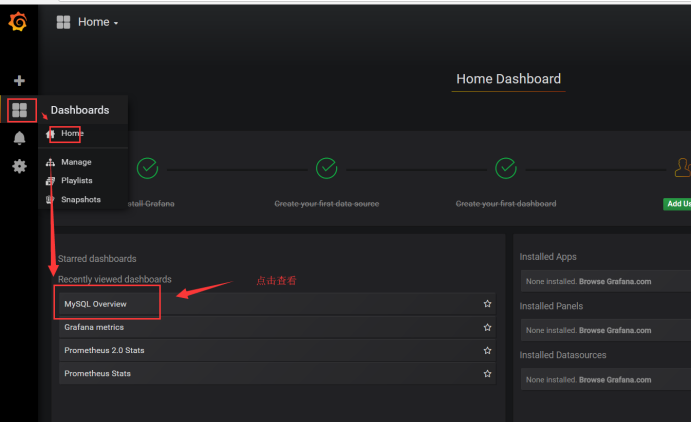
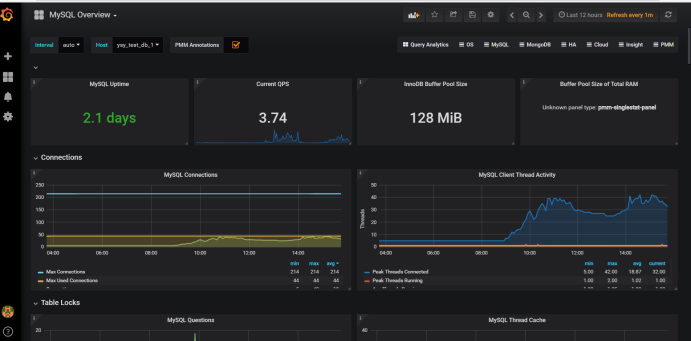
导入dashboards
6. 踩坑提醒
- 如果设置了防火墙,注意端口的开放
- 注意操作系统,我使用的操作系统是centos7.6